QC Lab Efficiency: A Practical Framework for Sustainable Performance
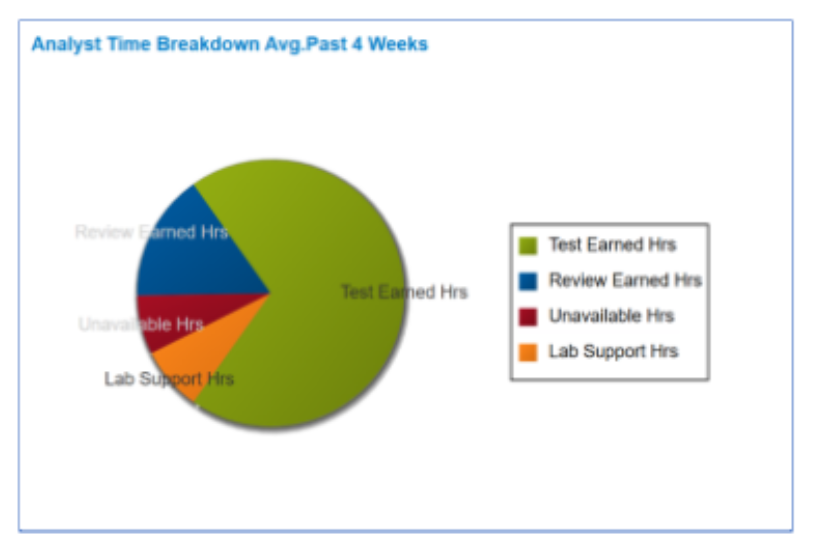
QC Lab Efficiency is one of the most misunderstood performance indicators in regulated laboratory environments. Many organizations define efficiency purely in terms of lot release activities — mainly testing and analytical review. While these activities generate direct value, they represent only part of how analyst time is actually consumed.
To measure QC Lab Efficiency accurately, laboratories must evaluate total analyst hours, distinguish value-add work from non-value activities, and align performance metrics with sustainable output — not just percentages.
The Core Problem in Measuring QC Lab Efficiency
In manufacturing environments, Overall Equipment Effectiveness (OEE) is widely used because equipment is the primary production asset.
In Quality Control laboratories, however, the real production asset is the analyst.
Unlike automated production lines, QC labs rely heavily on human-driven activities such as:
- Sample preparation
- Method execution
- Data analysis
- Documentation review
- Deviation investigations
- Calibration verification
- Cleaning and maintenance
- Training and compliance activities
If these time components are ignored, QC Lab Efficiency metrics become distorted and operational decisions suffer.
Why Traditional OEE Does Not Translate to QC
OEE focuses on:
- Availability
- Performance
- Quality
But in QC labs:
- Equipment availability does not equal analyst productivity.
- Idle instrument time does not always indicate inefficiency.
- High utilization does not guarantee optimal throughput.
Therefore, applying manufacturing OEE directly to QC environments leads to inaccurate benchmarking.
For regulatory and operational alignment, organizations often reference frameworks from the [International Society for Pharmaceutical Engineering (ISPE)] to adapt performance models appropriately.
Introducing Overall Lab Effectiveness (OLE)
A more relevant measurement approach for QC Lab Efficiency is Overall Lab Effectiveness (OLE).
OLE Formula:
OLE = Value-Add Hours (Testing + Review) ÷ Total Analyst Hours
This approach shifts focus from equipment to analyst productivity.
Step-by-Step Method to Improve QC Lab Efficiency
Step 1: Define Total Analyst Hours
Calculate total scheduled working hours per analyst per week.
Example:
- 40 hours per week
Step 2: Deduct Non-Value Activities
Subtract time spent on:
- Training
- Meetings
- Investigations
- Cleaning
- Instrument calibration
- Administrative work
- Planned absences
Assume 18 hours are consumed by these tasks.
Remaining testing hours: 22 hours
Step 3: Measure Value-Add Output
If the analyst completes:
- Four HPLC campaigns
- Each requiring 5.5 standard hours
Total value-add hours completed: 22 hours
Result:
- 22 ÷ 40 = 55% OLE
- 22 ÷ 22 = 100% efficiency of available testing time
This distinction is critical for accurate QC Lab Efficiency evaluation.
Why 100% Efficiency Can Still Be Misleading
A lab may report 100% efficiency relative to available testing hours.
However, if only 8–10 hours were available for testing, overall throughput remains limited.
True QC Lab Efficiency requires:
- Adequate testing hour allocation (15–20+ hours weekly benchmark)
- Balanced analyst workload
- Reduced unnecessary non-value tasks
- Controlled variability in investigations
Efficiency without capacity alignment results in low output despite strong ratios.
Strategic Benefits of Measuring QC Lab Efficiency Correctly
When OLE-based QC Lab Efficiency is implemented, laboratories gain:
- Accurate capacity planning
- Predictable lot release timelines
- Bottleneck identification
- Data-driven staffing decisions
- Reduced burnout risk
- Improved compliance readiness
This aligns closely with lean laboratory management and supports broader digital transformation initiatives.
Operational Benchmarks for Sustainable QC Lab Efficiency
To maintain sustainable performance:
- Target at least 15–20 value-add testing hours per analyst weekly
- Track investigation frequency and impact
- Monitor calibration time distribution
- Implement standardized review timelines
- Digitize workflow tracking
These controls prevent artificial efficiency inflation and promote consistent throughput.
Long-Term Impact on Lab Performance Metrics
QC Lab Efficiency should not be treated as a static KPI.
Instead, it should integrate with:
- Lab capacity planning strategy
- Overall Lab Effectiveness framework
- Digital QC transformation initiatives
- Continuous improvement programs
When aligned with operational data, QC Lab Efficiency becomes a predictive performance indicator — not just a historical measurement.
Key Takeaways
- QC Lab Efficiency must focus on analyst productivity, not instrument uptime.
- OLE provides a realistic measurement model.
- Available testing hours matter as much as efficiency percentage.
- Sustainable labs prioritize output stability over cosmetic KPIs.
- Accurate measurement drives strategic decision-making.
To implement a structured QC Lab Efficiency and Overall Lab Effectiveness framework in your organization, contact us about cResults.